
It is hard to navigate a course to a specific place if you do not know exactly where you are starting from. I use a tool in my turnaround consulting practice that provides specific analysis to map out where a client is relative to their own historical performance and just as importantly, relative to their competitors. With this tool, I can get a very good idea of what is going on with my client and what I need to do to improve their performance. Because it works so well, I have decided to make this tool available to any business who wants to get to where they are planning to go faster and more effectively! It provides significant value to businesses that are performing well, in addition to those that are having some issues.
Every industry, every market for that matter, has financial metrics that are key measurements of business performance — a measure of business success.
If you do not care about the success of your business, then knowing how you are performing does not matter. If you do not care about being in the top part of your competitive marketplace, then measuring your performance against your competitors is not for you. If you do care, then you need to understand the power of benchmarking!
In fact, benchmarking the performance of your business against its peers and general business best practices is critical to its successful management and growth.
Benefits of Benchmarking
The benefits of benchmarking are simple and powerful. By quantifying the gaps between your company’s key performance indicators (metrics) and those of your industry or financial best practices, you will essentially gain a clear map towards increased profits, cash flow and corporate value. Best of all, some of the work to close those gaps will be easy and relatively quick. Of course, some of the work will take longer and require more intentional planning. However, a financial performance analysis with same industry benchmarking is one of the best steps management can take to improve business performance.
This tool produces an easy-to-read narrative report that provides industry comparison benchmarking and what is essentially an insider’s view of how banks look at your business. It provides detailed analysis of a business’s liquidity, profits and profit margin, sales growth, and performance, how well the company manages its borrowing, how productive the company’s assets are, how effectively its employees contribute to the bottom line and various other industry specific performance ratios. This report compares your company’s financial statements to those of your competitors and provides an industry scorecard.
Each industry has specific key performance indicators that are important keys to measuring performance. By comparing these to an industry benchmark we are able to identify areas where the business might be able to improve operations and results.
Industry Financial Benchmark Analysis
When we perform an Industry Financial Benchmark Analysis, we also provide management guidance that includes top findings and an Action Plan with specific steps to achieve higher profits and increased cash flow. We will also highlight the most critical strategic advice within the report. We can also include a five-year projection and a discounted cash flow valuation of the subject business.
 For industry comparison benchmarking purposes, the financial statements are reduced to percentages of either sales or total assets. This is called common sizing the statements. Those numbers can more easily be compared to the industry where differences or opportunities can be more readily seen.
An industry scorecard highlights certain critical ratios and how they compare it to the industry. It also explains the formula for each ratio and the significance.
The next section is a five-year projection which can be modified by changing the projection assumptions. Business loans can be analyzed and modified with “what if” projections. Historical and projected ratio analysis is displayed.
Last, but certainly not least, is a Discounted Cash Flow Valuation that provides a value based upon projected future cash flows.
Financial Score
If you are using a relatively decent assessment or benchmarking service, they will provide a score for your financial performance. This will provide immediate visual feedback and let you know, in quantitative terms, how your business is performing. It will also allow you to measure the progress of your business toward its financial goals from period to period. Constant improvement is the key to success!
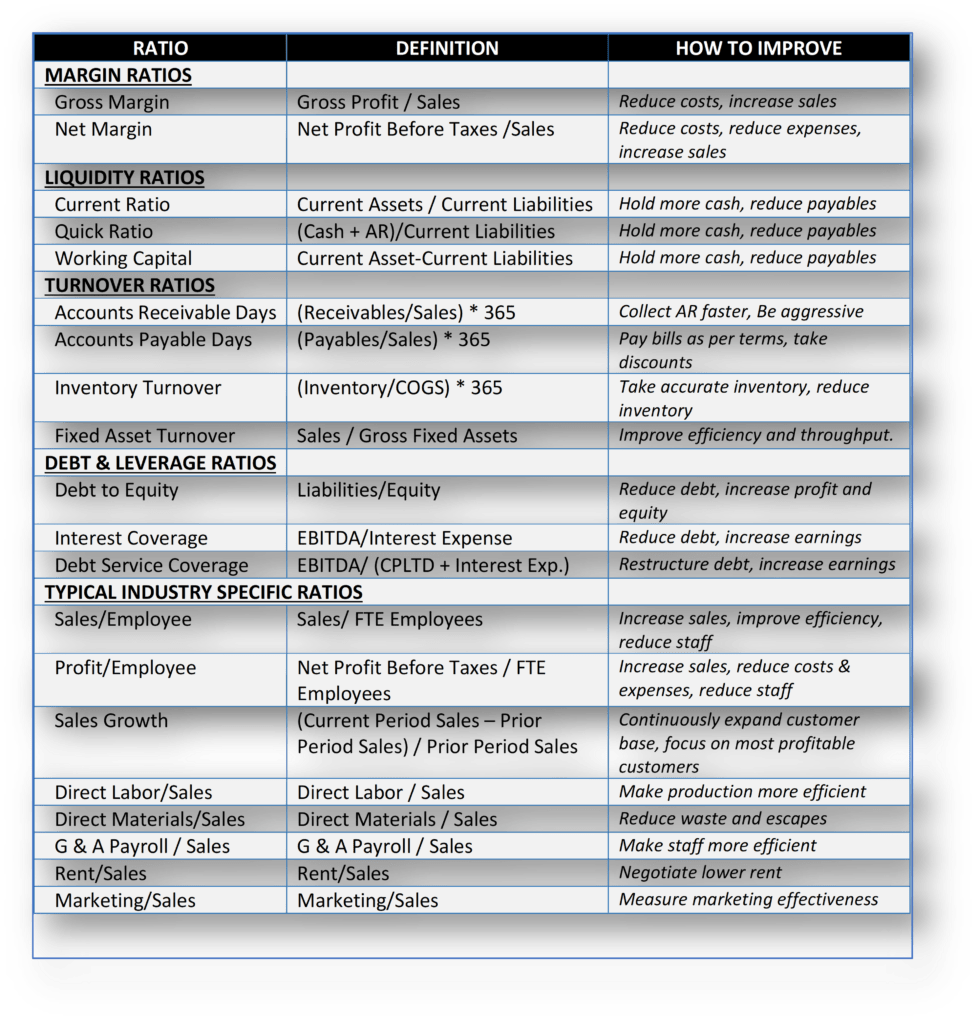
Typical Comparative Ratios
Key indicators of performance and applicable ratios vary from industry to industry. For information purposes some typical benchmarking ratios are listed below.
Sources for Benchmark Data
Industry benchmark data can be found in several places including:
- Industry/Trade Associations
- Small Business Development Centers (SBA, SCORE, Economic Development Centers)
- Other Business Owners in the Same Business (best practices groups)
- Benchmark & Financial Assessment Services (typically the most robust and accurate)
Avoid Pitfalls
When preparing a benchmark analysis, it is important to watch out for common pitfalls. The most significant of these pitfalls are as follows:
- Timeliness: it is important to compare data from the same time periods. Since businesses and environmental influences change constantly, it is also important that you have the most recent data possible. Annual benchmark analysis is seldom sufficient. A more appropriate regime is a quarterly review including performance scoring and competitive industry benchmarking.
- Accuracy: Benchmark data needs to be reliable. With that in mind, make sure the source of your data is trustworthy and has accurate information.
- Sameness: When comparing companies, it is important that we compare apples to apples. In other words, an auto parts electronics supplier is going to have different margins and requirements then an auto parts stampings supplier. Make sure the source of your data is relevant to the company you are benchmarking. In other words, is it in the same geographic and e
 conomic marketplace as your target company? Are the company sizes similar? Are the time periods the same?
 - Choose the right metrics: Ensure that the metrics you have chosen for your benchmark analysis are key to the performance of industry peers and that they accurately depict the true performance of the target within its industry.
- Read and Forget: Many managers may be tempted to simply review the results of a benchmark analysis, take note, and then just return to running the business as usual. This is a strategic mistake. If you want to be intentional about driving your business in the right direction, it is important that you not only take note of the variances between your business and the industry’s best practice benchmarks, but that serious strategic efforts are put into place to close the variances between your business’s metrics and those indicated as the industry’s best practices. Obtaining the variances is just the beginning.

At the end of the day, benchmarking your business against similar companies in your industry is one of the best ways to improve business performance. I enthusiastically recommend this analysis to any business that wants to improve its profits and market value.
If you are interested in a discussing a Financial Performance Benchmarking Report for your business or would like to refer us, please click here.