
Every industry, every market for that matter, has financial metrics that are key measurements of business performance — a measure of business success.
 If you don’t care about the success of your business, then knowing how you are performing doesn’t matter. If you don’t care about being in the top part of your competitive marketplace, then measuring your performance against your competitors is not for you. If you do care, then you need to understand the power of benchmarking!
In fact, benchmarking the performance of your business against its peers and general business best practices is critical to its successful management and growth.
Avoid Pitfalls
When preparing a benchmark analysis, it is important to watch out for common pitfalls. The most significant of these pitfalls are as follows:
- Timeliness: it’s important to compare data from the same time periods. Since businesses and environmental influences change constantly, it’s also important that you have the most recent data possible. Annual benchmark analysis is seldom sufficient. A more appropriate regime is a quarterly review including performance scoring and competitive industry benchmarking.
- Accuracy: Benchmark data needs to be reliable. With that in mind, make sure the source of your data is trustworthy and has accurate information.
- Sameness: When comparing companies, it is important that we compare apples to apples. In other words, an auto parts electronics supplier is going to have different margins and requirements then an auto parts stampings supplier. Make sure the source of your data is relevant to the company you’re benchmarking. In other words, is it in the same geographic and economic marketplace as your target company? Are the company sizes similar? Are the time periods the same?
- Choose the right metrics: Ensure that the metrics you have chosen for your benchmark analysis are key to the performance of industry peers and that they accurately depict the true performance of the target within its industry.
- Read and Forget: Many managers may be tempted to simply review the results of a benchmark analysis, take note, and then just return to running the business as usual. This is a strategic mistake. If you want to be intentional about driving your business in the right direction, it is important that you not only take note of the variances between your business and the industry’s best practice benchmarks, but that serious strategic efforts are put into place to close the variances between your business’s metrics and those indicated as the industry’s best practices. Obtaining the variances is just the beginning.
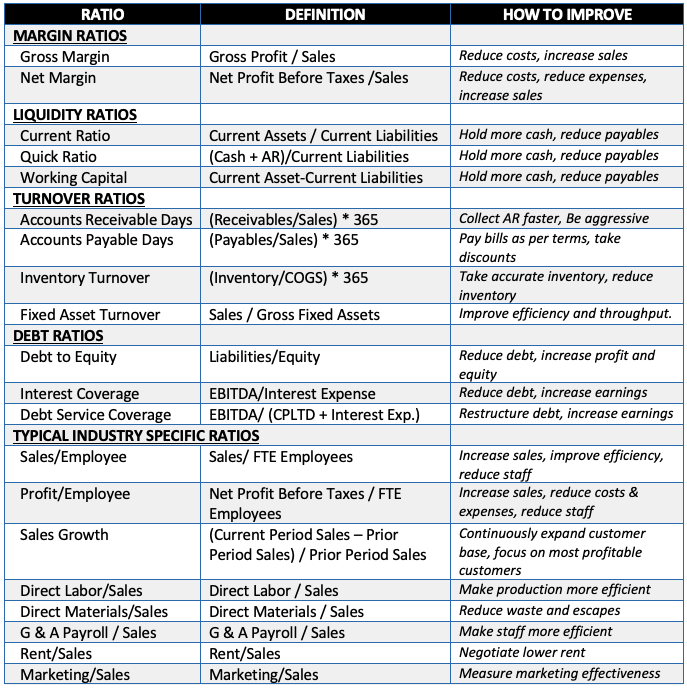
Typical Comparative Ratios
Key indicators of performance and applicable ratios vary from industry to industry. For information purposes some typical benchmarking ratios are listed below.
Sources for Benchmark Data
Industry benchmark data can be found in several places including:
- Industry/Trade Associations
- Small Business Development Centers (SBA, SCORE, Economic Development Centers)
- Other Business Owners in the Same Business (best practices groups)
- Benchmark & Financial Assessment Services (typically the most robust and accurate)
Financial Score
If you are using a relatively decent assessment or benchmarking service, they will provide a score for your financial performance. This will provide immediate visual feedback and let you know, in quantitative terms, how your business is performing. It will also allow you to measure the progress of your business toward its financial goals from period to period. Constant improvement is the key to success!
Benefits of Benchmarking
 The benefits of benchmarking are simple and powerful. By quantifying the gaps between your company’s key performance indicators (metrics) and those of your industry or financial best practices, you will essentially gain a clear map towards increased profits, cash flow and corporate value. Best of all, some of the work to close those gaps will be easy and relatively quick. Of course, some of the work will take longer and require more intentional planning. However, at the end of the day benchmarking is one of the very best ways to highlight opportunities and improve business performance.
For a free report of benchmarking data for your industry, click here.
For a no obligation quote (including a 20% discount) on a detailed performance assessment, including a comprehensive industry benchmarking report, click here.
Kevin M. Burke, CTP
Burke Advisory Services
February 17, 2020
Kevin Burke is a member of the Turnaround Management Association and a Certified Turnaround Professional. A graduate of the Villanova School of Business, he has over 35 years of experience in banking and executive management. His management consulting practice is located in Troy, Michigan.